
Studio Dashboard
Runtime metrics and active AI tasks at a glance.
Studio Dashboard
The Dashboard is the home screen after signing in. It shows monthly local Runtime impact, live Runtime health, and active AI tasks.
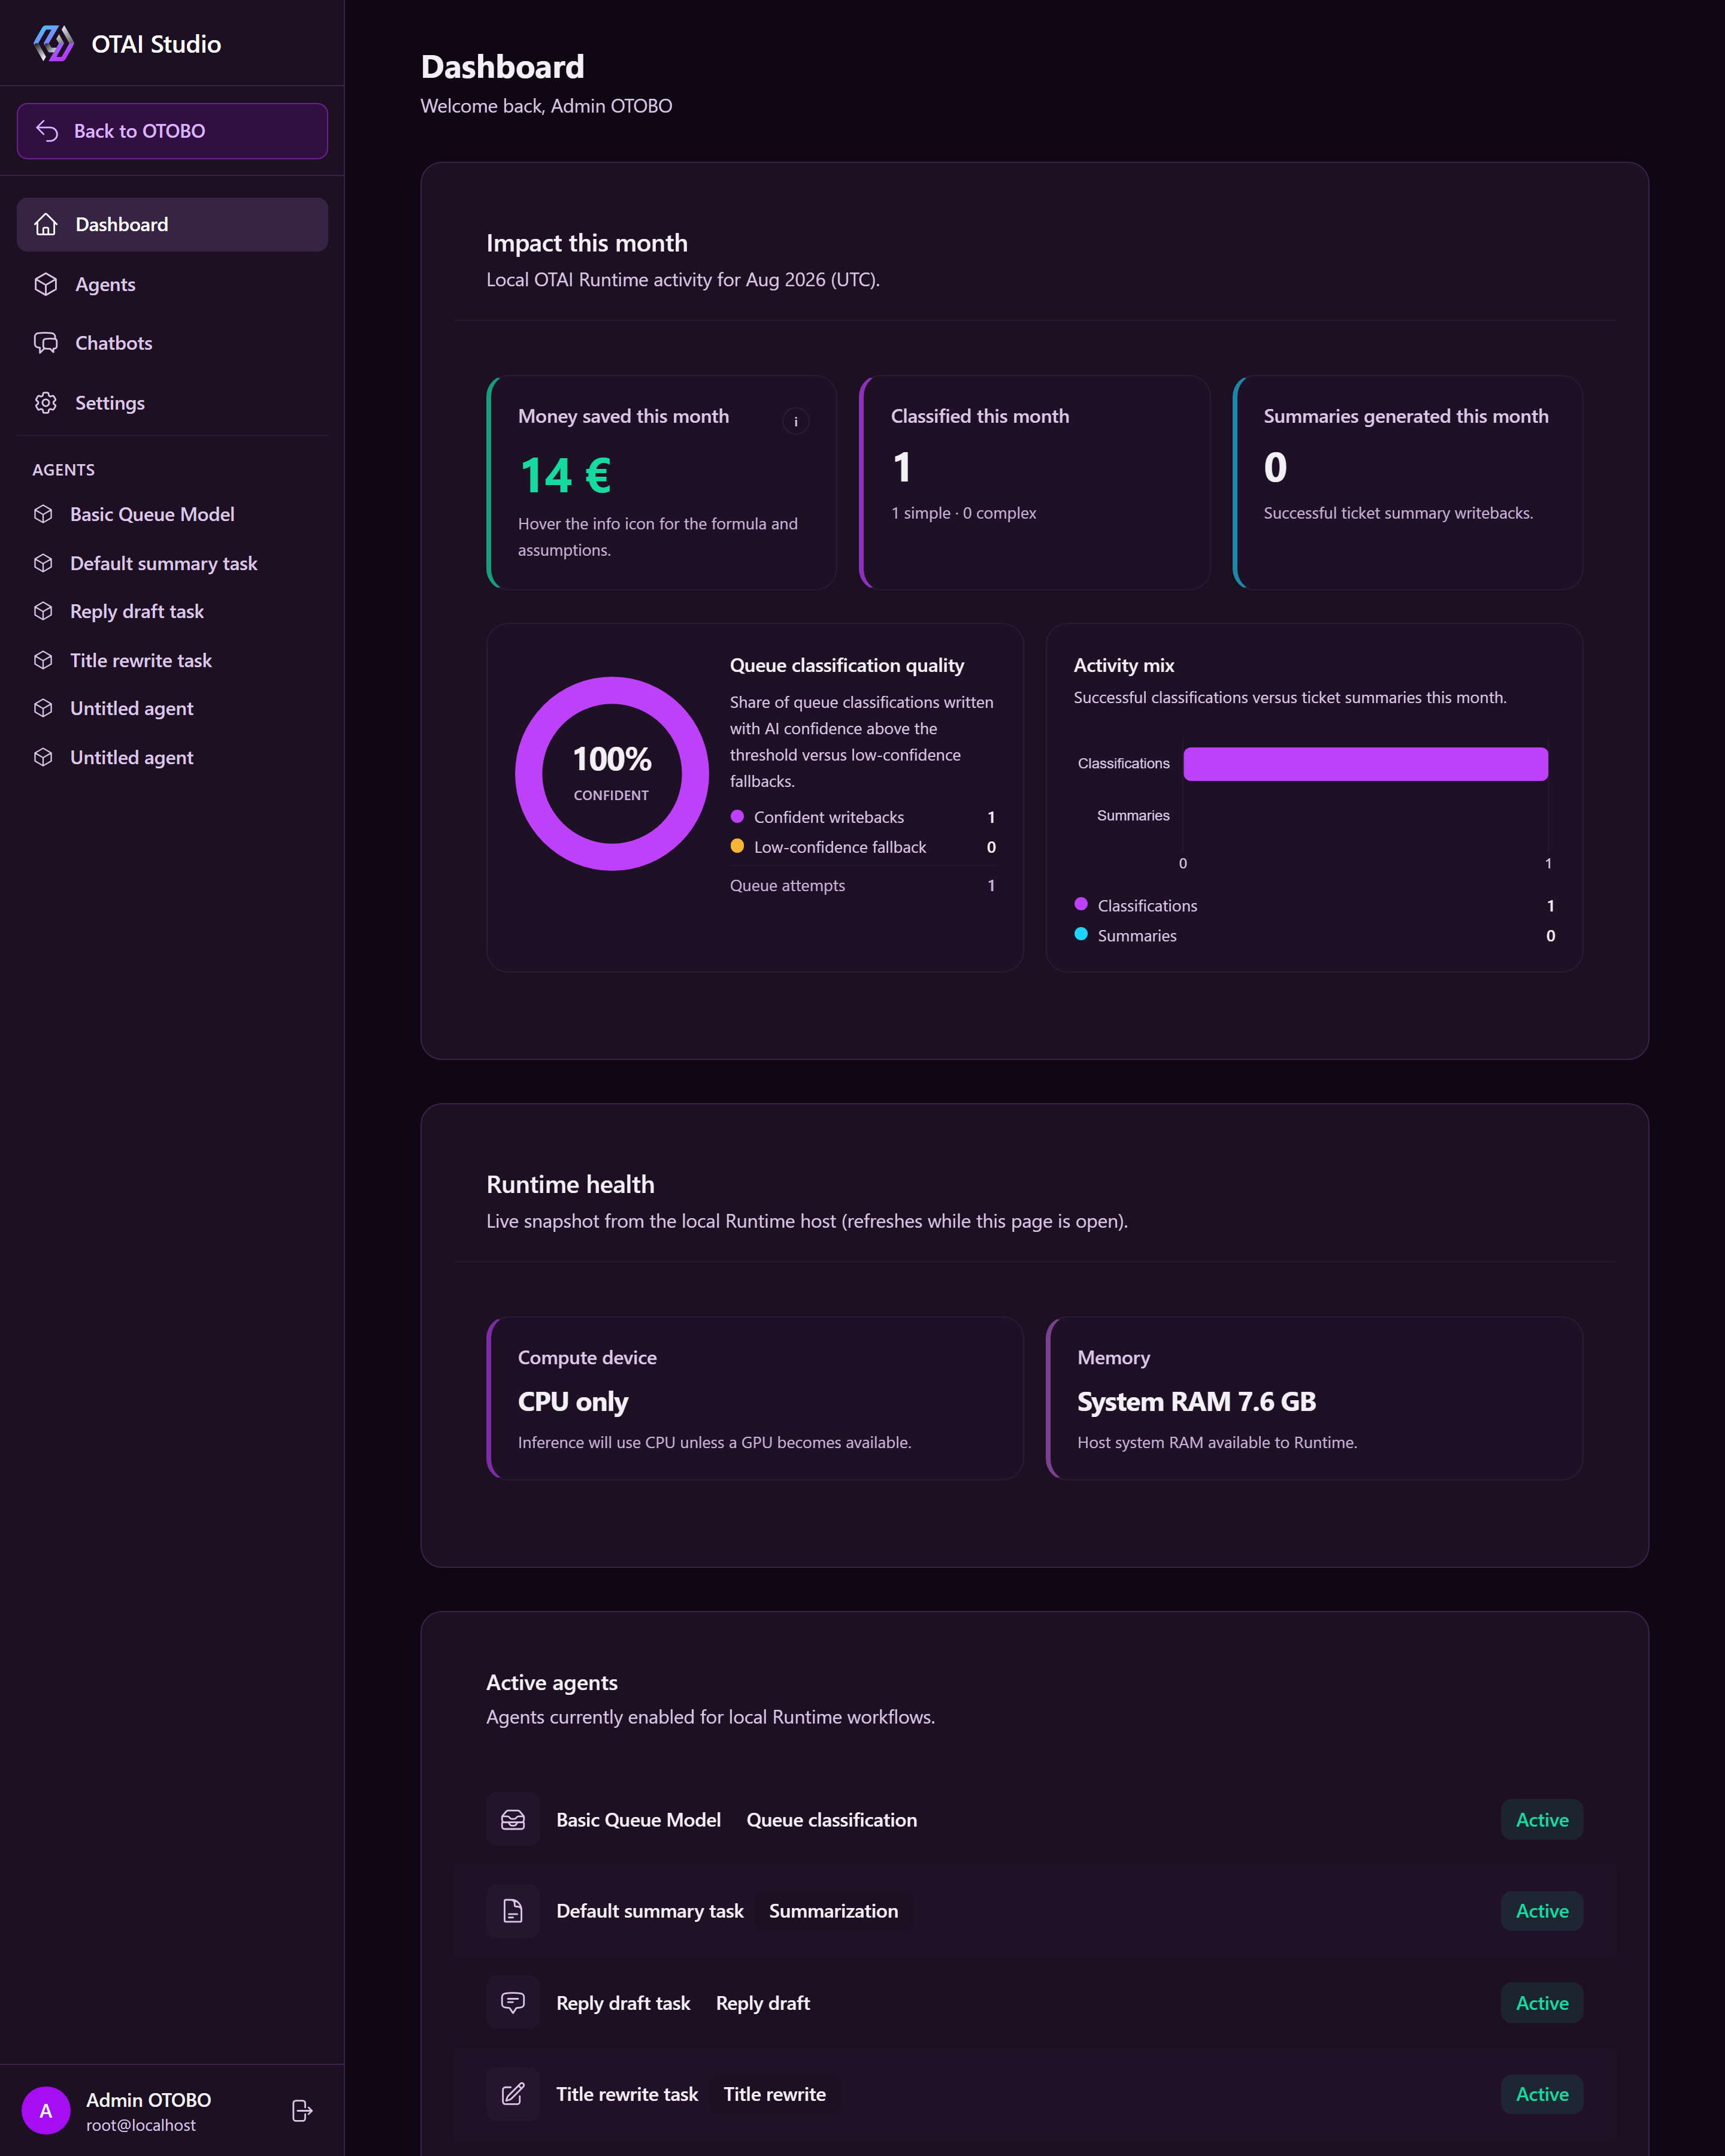
Impact this month
Figures come from local OTAI Runtime, with the title showing the current UTC month (e.g. Jul 2026 (UTC)).
| Metric | Meaning |
|---|---|
| Money saved this month | Estimated savings (see i icon for assumptions) |
| Classified this month | Successful classifications (simple vs complex by label count) |
| Summaries generated this month | Successful ticket summary writebacks |
| Queue classification quality | Confident queue writebacks vs low-confidence fallbacks |
| Activity mix | Classifications vs summaries |
An empty-state message explains next steps if no activity exists. If Runtime is unreachable, a warning appears and values remain empty (— / …).
Runtime health
Live snapshot of the Runtime host:
- Compute device (GPU name or CPU)
- VRAM usage (or system RAM on CPU hosts)
The snapshot refreshes automatically while open.
Active AI tasks
Lists tasks currently running with status Active.
- Click a row to open the task.
- Create or activate tasks on the AI Tasks page.
Navigation
Left sidebar options:
- Dashboard — this page
- AI Tasks — list and create tasks
- Settings — account and license
- Back to … — return to ticket system